
Using Data Analytics to Improve Security in Dallas Commercial Properties

Data analytics improves security in Dallas commercial properties by identifying crime patterns across neighborhoods before losses occur. Security analytics tools monitor and analyze incident data to reveal predictable clustering of break-ins in areas like Deep Ellum and the Design District. This data-driven approach helps property managers spot vulnerabilities, allocate resources more effectively, and implement preventive measures based on actual risk patterns rather than guesswork.
Dallas reported over 47,000 property crimes in a recent year, and commercial break-ins cluster in predictable ways across neighborhoods like Deep Ellum and the Design District. Security analytics gives property managers a way to see those patterns before losses pile up. This post explains how data-driven monitoring works, what it catches, and how Dallas businesses can put it to use.
You manage buildings, not spreadsheets. But the numbers your cameras and access systems produce can stop crimes your guards might miss.
What Security Analytics Means for Dallas Commercial Properties
Security analytics is the practice of collecting data from cameras, sensors, and access logs, then studying it to predict and prevent incidents. It turns raw video into patterns you can act on.
Traditional monitoring reacts. Someone watches a screen and calls for help after something happens. Analytics flips that order.
For Dallas commercial properties, this shift matters. Loading docks, parking garages, and vacant retail spaces each generate their own risk signals over time.
The Difference Between Watching and Analyzing
A guard watching 16 camera feeds cannot track every anomaly at once. Fatigue sets in after two hours.
Analytics software never blinks. It flags loitering, tailgating at doors, and vehicles that circle a lot three times.
- Object detection spots a person in a restricted area at 2 a.m.
- Behavior patterns catch someone testing car door handles row by row.
- Access anomalies reveal a badge used at two doors five minutes apart on opposite ends of a building.
How Data Analytics Identifies Patterns and Prevents Incidents
Data reveals repeat behavior that single events hide. One trespasser looks random. Ten trespassers hitting the same fence gap at the same hour is a pattern.
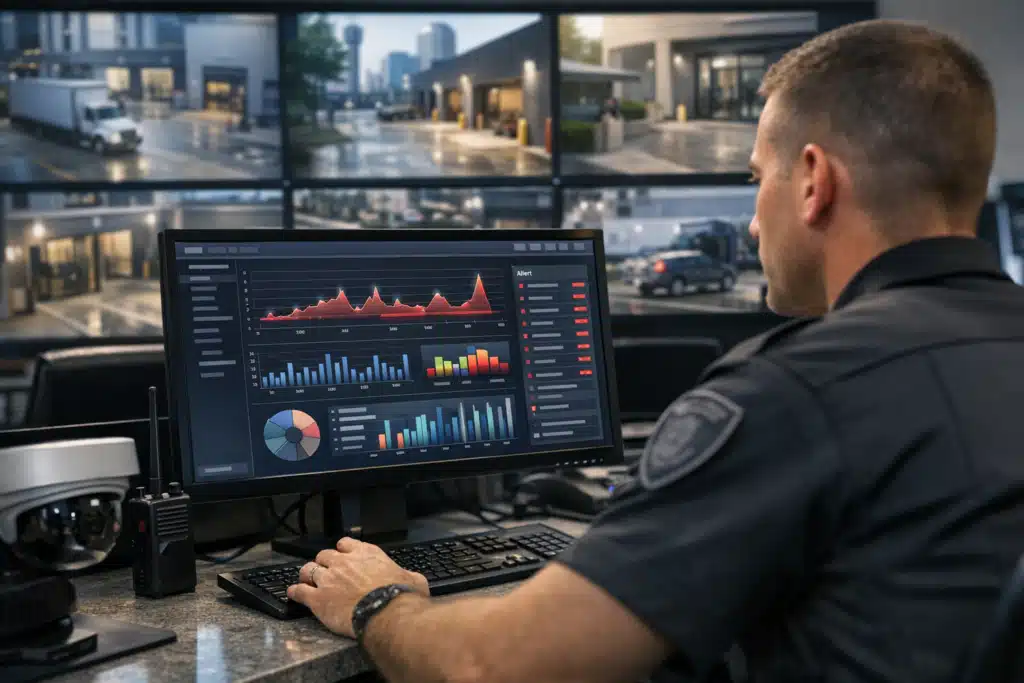
Here is how the pattern-finding works in practice at a Dallas site.
Step-by-Step: From Raw Footage to Prevention
- Collect timestamped events from cameras, gates, and motion sensors across weeks.
- Sort incidents by time of day, location, and type.
- Map where alarms cluster on your property footprint.
- Predict the next likely window and location for an attempt.
- Position guards or trigger deterrents before that window opens.
A warehouse near Stemmons Freeway saw copper theft attempts every Sunday between 3 and 5 a.m. Analytics surfaced that trend after three weeks. A remote operator now watches that zone during that window and triggers audio warnings.
A Real Pattern Most Managers Miss
Thieves scout before they strike. Analytics catches the scouting.
A vehicle that drives past your entrance slowly on Monday, Wednesday, and Friday is gathering information. Software matching license plates across days flags that repeat visit. You act during reconnaissance, not after the theft.
Why This Matters for Dallas Business Owners
Dallas construction activity stays heavy year-round, and job sites are prime targets for equipment and material theft. Copper, tools, and generators disappear overnight.
Data-driven monitoring cuts false alarm calls too. Dallas police charge fees for repeat false alarms under city ordinance. Analytics filters wind-blown debris from real intruders and reduces those charges.
Cost Comparison: On-Site Guards vs. Analytics-Backed Remote Monitoring
A single on-site guard covering nights runs a set hourly rate around the clock. Remote video monitoring with analytics covers the same site for less per hour.
- On-site guards give physical presence and immediate response but cover one location at a time.
- Remote monitoring watches multiple zones at once with data flagging events for operators.
- Combined coverage puts guards where analytics says risk is highest, cutting wasted patrol hours.
Many Dallas property managers pair both. Analytics decides where the guard walks and when.
Applying Security Analytics at Your Dallas Property
Start with the data you already produce. Most existing camera systems store footage nobody reviews until after an incident.
Four Practical Moves for Local Managers
- Audit your current cameras. Identify blind spots at entrances, docks, and back alleys common in older Dallas commercial buildings.
- Log every incident for 30 days. Note time, location, and type. Small logs reveal big patterns.
- Set analytics rules for your risk hours. Retail near NorthPark faces daytime theft; industrial sites face overnight intrusion.
- Review the data monthly with your provider. Patterns shift with seasons and construction cycles.
Apartment Communities and Event Venues
Multifamily properties in Dallas track different signals. Package theft, unauthorized pool access, and parking lot break-ins each leave data trails.
Event venues watch crowd flow and entry points. Analytics counts occupancy and flags bottlenecks before they become safety issues.

 Posted on Google
Common Questions Dallas Managers Ask
Does analytics replace security guards?
No. It directs them. A guard responding to a data-flagged alert acts faster than one patrolling blind.
How long before patterns appear?
Most sites show usable patterns within two to four weeks of steady data collection.
Is my old camera system compatible?
Many analytics platforms work with existing IP cameras. An assessment confirms what your hardware supports.
Turning Data Into a Safer Property
Security analytics finds the patterns behind crime so you prevent incidents instead of documenting them. Dallas commercial properties that pair data-driven monitoring with well-placed guards see fewer losses and lower response times.
Twin City Security Dallas builds monitoring plans around your property’s own data. Call or text 972‑385‑1144, email Dallas@twincitysecurity.com, or visit https://www.twincitysecuritydallas.com for a Dallas security assessment.
Sources
- FBI – Uniform Crime Reporting Program
- Dallas Police Department – Official City Page
- City of Dallas – Open Data Portal
Security analytics helps Dallas commercial property managers identify crime patterns from camera and sensor data to prevent incidents before they occur. The approach combines data-driven monitoring with guard placement to reduce losses and false alarm fees.
- Dallas reported over 47,000 property crimes recently, with break-ins clustering in areas like Deep Ellum and the Design District. Analytics software flags behaviors like loitering and repeat vehicle visits that guards might miss.
- The process involves collecting timestamped events over weeks, mapping where alarms cluster, and predicting likely windows for attempts. A warehouse near Stemmons Freeway stopped copper theft by identifying a Sunday morning pattern.
- Property managers can start by auditing cameras for blind spots, logging incidents for 30 days, and setting analytics rules for high-risk hours. Most sites show usable patterns within two to four weeks.